“The attack surface is the vulnerability. Finding a bug there is just a detail.”
— Mark Dowd“Some details are more important than others.”
— Fedor G. Pikus
Initial release
Last year I published a collection of Semgrep rules that I developed to facilitate C/C++ vulnerability research. I also wrote a couple of accompanying blog posts to introduce my ruleset and to show how to use it to automate binary vulnerability discovery.
My research was well-received by the team behind Semgrep:
Community member spotlight on…. Marco Ivaldi, aka @0xdea!
We retweeted a blog post he wrote earlier this week on pen testing binaries with Semgrep, but he's also written a wealth of C++ rules (35!) to catch vulnerabilities: https://t.co/FUgVuuMzKV
— Semgrep (@semgrep) July 8, 2022
Want to protect your codebase against vulnerabilities in binaries you may be using? @0xdea cleverly combines Ghidra with #Semgrep to scan for just that. Read how: https://t.co/O5qpV014EJ
— Semgrep (@semgrep) July 7, 2022
Furthermore, probably because it filled a gap, my work sparked quite a lot of interest in the security research community. Over the following months, a bunch of independent projects that referenced my ruleset and tooling popped up on GitHub. Here are a few examples:
- https://github.com/e-m-b-a/emba
- https://github.com/JetP1ane/Callisto
- https://github.com/20urc3/Sekiryu
- https://github.com/VulnTotal-Team/Vehicle-Security-Toolkit
- https://github.com/iosifache/semgrep-rules-manager
- https://github.com/falcosecurity/falco
- https://github.com/brave/security-action
Big update
Fast forward to 2023. In the past months, while tackling some code review projects, I’ve been working to improve my Semgrep ruleset.
Beside the experience gained in the field during my ongoing vulnerability research efforts, I’ve used as input what I learned by attending some training courses (OST2‘s Vulns1001 and Vulns1002, and InfoSect‘s Code Review) and I’ve tested my rules against a number of SAST test suites and test cases, conveniently collected by NIST’s Software Assurance Metrics And Tool Evaluation (SAMATE) project.
As a result, the ruleset now features a total of 48 rules. The newest rules are:
- Memory management
- incorrect-use-of-free.yaml – Calling free() on memory not on the heap.
- putenv-stack-var.yaml – Call to putenv() with a stack-allocated variable.
- Race conditions
- insecure-api-signal.yaml – Use of insecure API function signal().
- Miscellaneous
- incorrect-use-of-memset.yaml – Wrong order of arguments to memset() << you wouldn’t believe how many instances of this simple bug are lurking in production code!
- incorrect-use-of-sprintf-snprintf.yaml – Source and destination overlap in sprintf() and snprintf().
- suspicious-assert.yaml – Potentially invalid size check due to use of assertion macros << this is another popular bug
- unchecked-ret-scanf-etc.yaml – Unchecked return code of functions in the scanf() family << also a powerful bug
- argv-envp-access.yaml – Command-line argument or environment variable access.
- missing-default-in-switch.yaml – Missing default case in a switch statement.
- missing-break-in-switch.yaml – Missing break or equivalent in a switch statement.
- missing-return.yaml – Missing return statement in non-void function.
I’ve also improved both accuracy and performance of many old rules.
In addition, I’ve reorganized the rules into three tiers to improve the bug hunting experience against large codebases. You can now run a scan aiming at quick wins (low-noise, high-priority bug reports only), high and medium-priority bugs, or a classic full-scan that might include also many false positives, simply by using the following commands:
# high priority scan
$ semgrep --severity ERROR --config PATH/TO/RULES PATH/TO/SOURCE

# high and medium priority scan
$ semgrep --severity ERROR --severity WARNING --config PATH/TO/RULES PATH/TO/SOURCE

# full scan
$ semgrep --config PATH/TO/RULES PATH/TO/SOURCE
Finally, I’ve discovered the Static Analysis Results Interchange Format (SARIF) standard, which I recommend using for a better streamlined experience, as explained in the next sections.
Static analysis methodology
The first step in any vulnerability research effort is picking the target. There are different approaches that may work for you:
- Select a target that is somehow already familiar to you.
- Select a popular target that has a record of poor security and lots of CVEs.
- Conversely, select a less-researched target that is likely to have undiscovered vulnerabilities.
- Select a target that interests or intrigues you for some other reason.
Ultimately, it’s your choice. In my opinion, all C programs that parse complex data are likely buggy:
Depending on the selected target, your static analysis methodology will vary. If you’re auditing a small codebase you can probably read it line by line to find bugs. With large codebases it’s not that simple.
The key to auditing large programs is understanding the attack surface and being aware of trust boundaries between attacker-controlled input and privileged code, while peeling off layers of abstraction. In general, you can use either one of the following approaches:
- Top-down: start where attacker-controlled input is provided and work downwards checking if it leads to a bug.
- Bottom-up: start where the bugs are likely to be (hotspots or “code smells”) and work upwards checking if input is attacker-controlled.
My Semgrep ruleset (as well as some other tools I’ve released in the past) should help with the bottom-up approach, by isolating hotspots in code where bugs are likely to manifest. If you’re interested in exploring other approaches, I’d recommend reading The Art of Software Security Assessment (TAOSSA) by Mark Dowd and friends. While a bit dated by now, I think this book is still very much relevant when it comes to C audits.
Coming back to our static analysis methodology, here’s a simplified outline that can be used to quickly audit a large codebase with the help of Semgrep:
- Read the documentation, especially about past vulnerabilities, to uncover attack surface and interesting paths.
- Scan with Semgrep and other tools against interesting paths in the codebase.
- Perform a first manual review of scan results to quickly mark hotspots in code where potential bugs may be.
- Perform a second manual pass to understand and explore relevant code around the hotspots, discard false positives, and identify potential vulnerabilities.
- Confirm the presence of security vulnerabilities and other bugs via further analysis, dynamic testing, targeted fuzzing, etc.
- Identify variants of confirmed vulnerabilities in other parts of the codebase, by creating custom rules if needed.
Remember that static analysis should prove the properties of a program that are true for all possibile executions, while dynamic analysis only proves properties for particular executions. In most cases, a mix of static and dynamic analysis is recommended. For further considerations on methodology, check out the videos of some of my talks.
Step-by-step example
It’s time to show how to apply our methodology in the field with a step-by-step example. As a sample target, I’ve picked Zephyr 3.4.0 which I’ve previously audited with some success.
First, by reading the documentation about previous vulnerabilities, we can determine that the subsys and drivers paths in the codebase expose an encouraging attack surface. Let’s focus on them:
# download and untar release 3.4.0
raptor@blumenkraft Research % wget https://github.com/zephyrproject-rtos/zephyr/archive/refs/tags/v3.4.0.tar.gz
raptor@blumenkraft Research % tar xvfz v3.4.0.tar.gz

# perform quick-win scans against subsys and drivers directories
raptor@blumenkraft Research % cd zephyr-3.4.0
raptor@blumenkraft zephyr-3.4.0 % semgrep --sarif --severity ERROR --config /Users/raptor/Downloads/github/semgrep-rules subsys > SUBSYS_ERROR.sarif
raptor@blumenkraft zephyr-3.4.0 % semgrep --sarif --severity ERROR --config /Users/raptor/Downloads/github/semgrep-rules drivers > DRIVERS_ERROR.sarif

# also scan for medium priority bugs in those directories
raptor@blumenkraft zephyr-3.4.0 % semgrep --sarif --severity WARNING --config /Users/raptor/Downloads/github/semgrep-rules subsys > SUBSYS_WARNING.sarif
raptor@blumenkraft zephyr-3.4.0 % semgrep --sarif --severity WARNING --config /Users/raptor/Downloads/github/semgrep-rules drivers > DRIVERS_WARNING.sarif

# run VSCode with SARIF viewer to browse scan results
raptor@blumenkraft zephyr-3.4.0 % code .
Semgrep’s performance is astounding. The quick-win scans will terminate in just a few seconds, while scans for medium-priority bugs will require a bit more time. Go grab a coffee and come back later. Of course, you can (and you should) customize the rules to make them more effective and efficient against the specific codebase you’re analyzing (hint: use the --time flag to highlight potential performance issues in your ruleset). If you’re lazy and don’t want to perform the scans yourself but would still like to play with Semgrep results in VSCode, you can download the SARIF output files directly from here. You’re welcome, but if you’re serious about being a vulnerability researcher you should really put in the work 🤨
Once the scans are finished, open the codebase in VSCode. Make sure to have the SARIF Viewer extension installed, along with other useful extensions for code navigation such as C/C++ IntelliSense. Personally, I also use this cute little extension that helps me keep track of interesting variables in the code listing. Hopefully it’s not too backdoored 😉 Security Notes and Bookmarks are also worth checking out. Finally, Semgrep has its own official extension, although I’m not showing it in this example.
The following screenshot (you may click on it to view it full-size) shows that Semgrep was able to identify 2773 total hotspots in the drivers directory, related to potential high-priority (9 results) and medium-priority (2764) bugs:
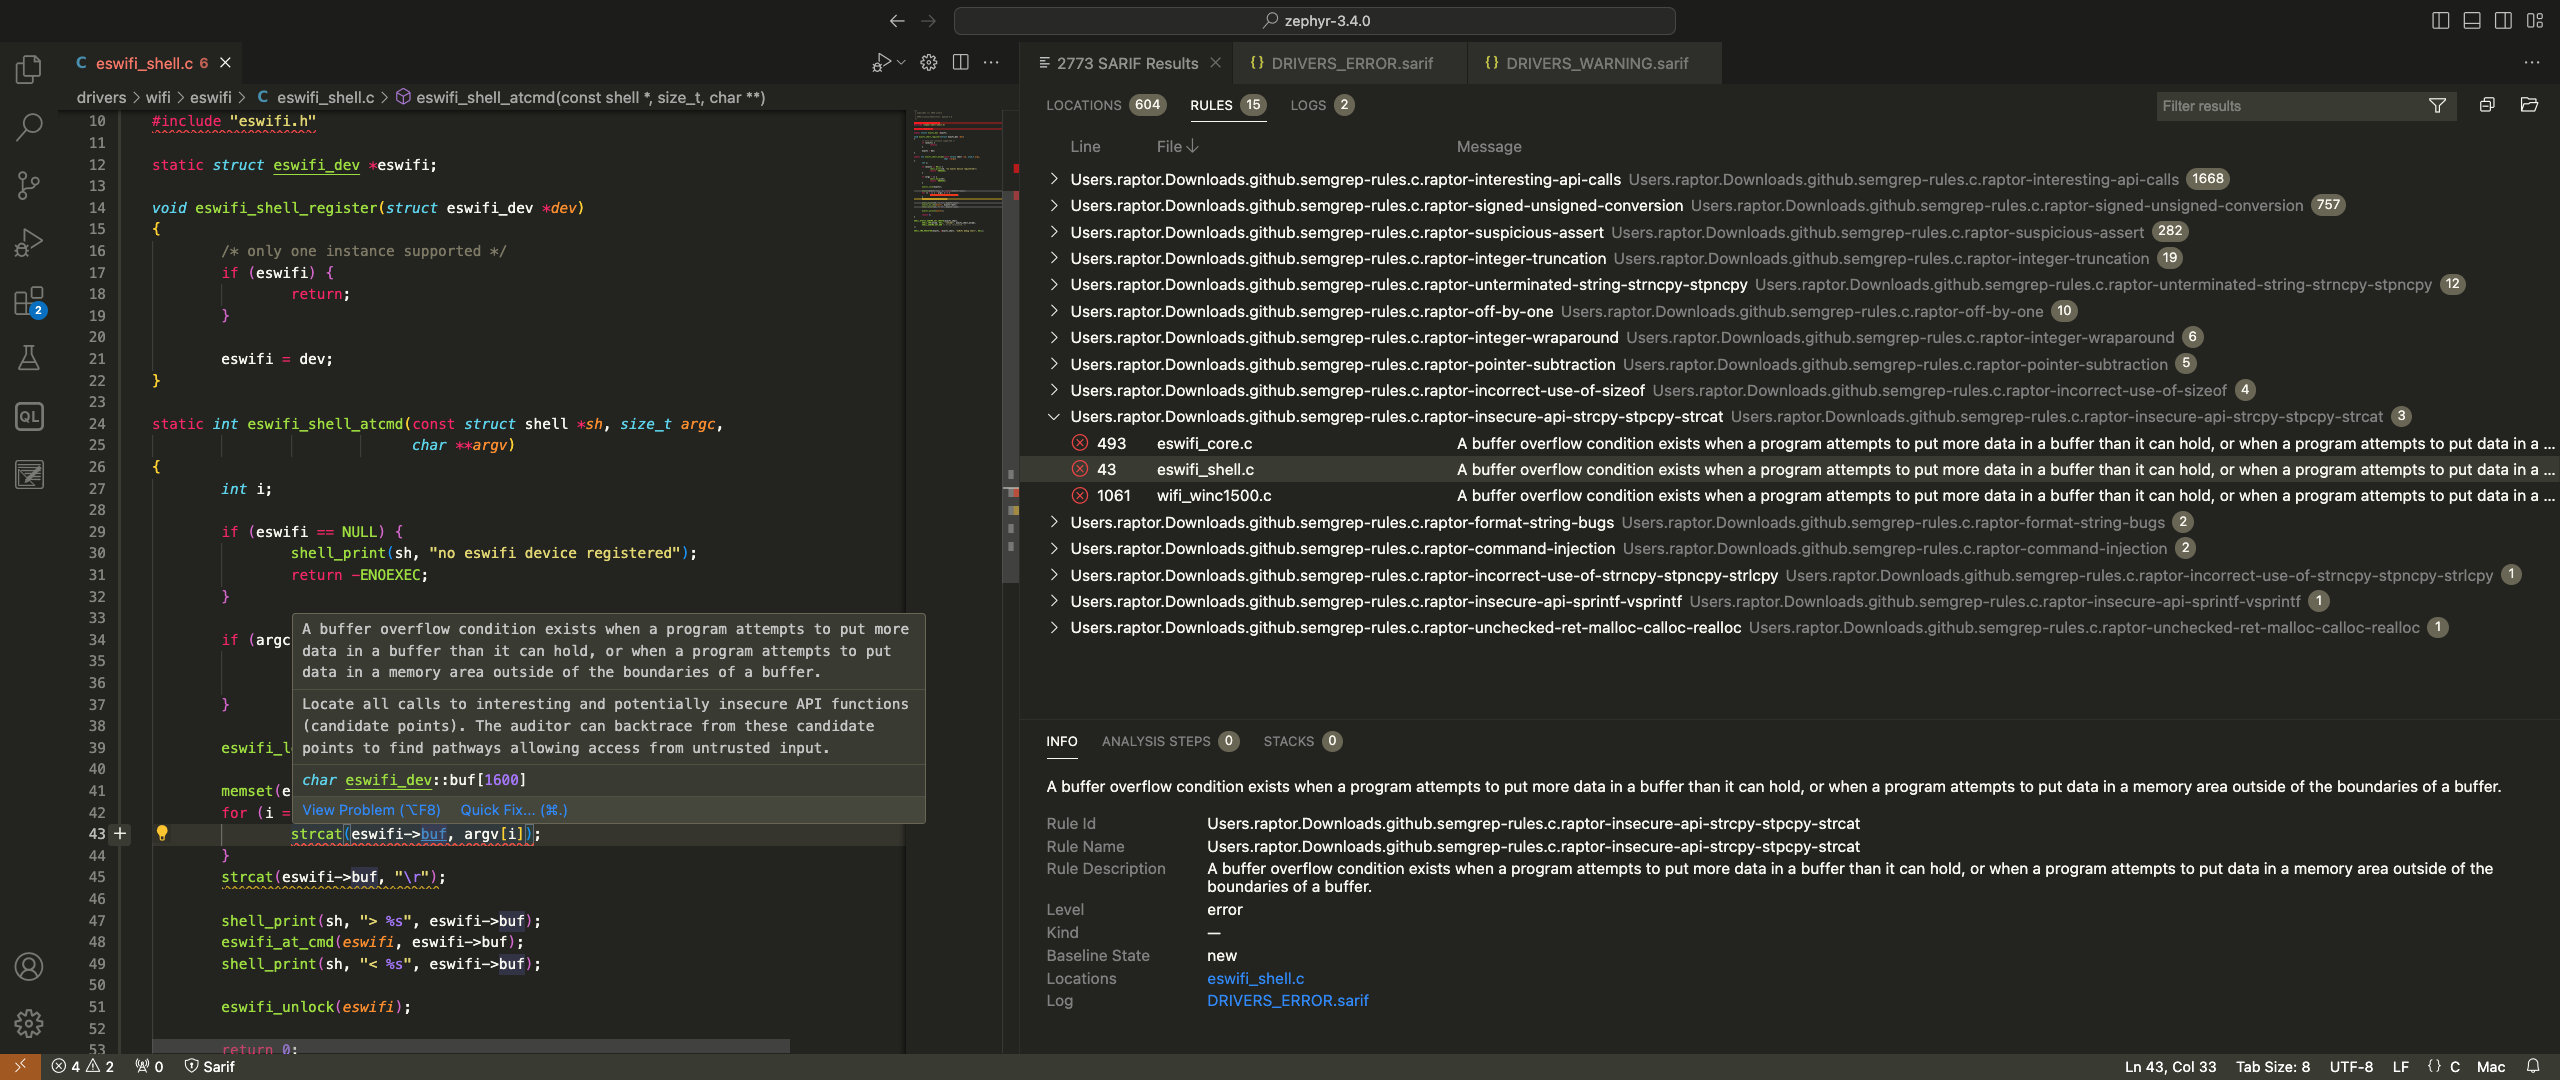
A specific scan result is highlighted. As it turns out, there was indeed a buffer overflow due to strcat() use at that location of the source code, which I’ve reported to the Zephyr project and is now fixed. Not bad for a quick scan with my default rules, right?
So, the plan here is to navigate all scan results, bookmarking the locations of potential bugs, and come back to them later to understand the code, discard false positives, and confirm the presence of security vulnerabilities. Finally, you should search for variants of the confirmed vulnerabilities in other parts of the code, perhaps again with the help of custom Semgrep rules. For large codebases it’s still a time-consuming process, but it’s definitely feasible as opposed to reading all the code line by line.
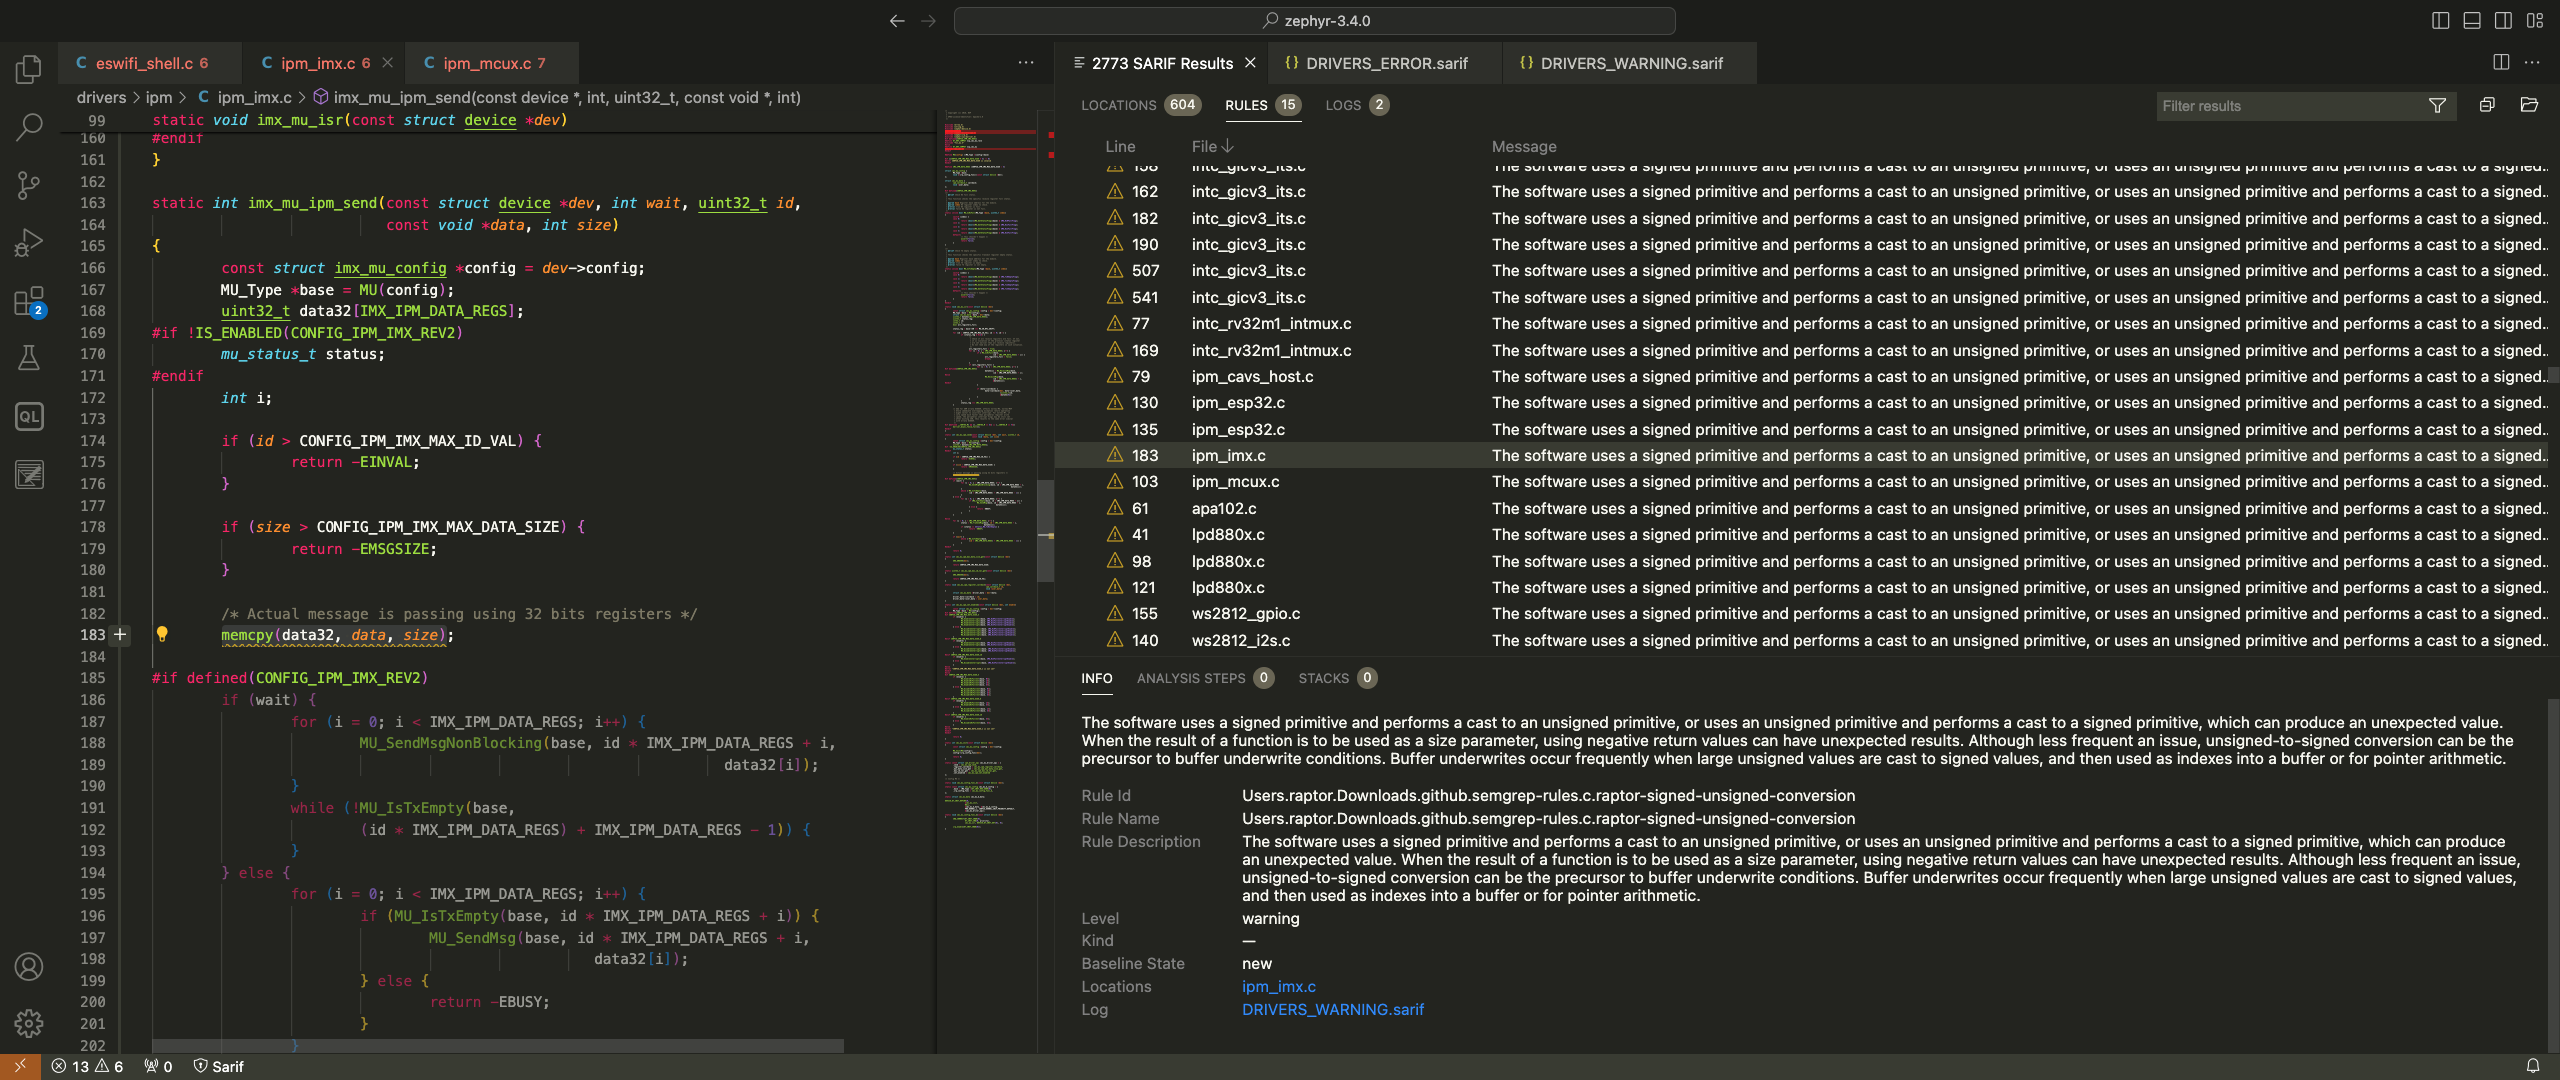
The following screenshot shows another actual bug that I’ve discovered in the Zephyr IPM driver. This one is a signed to unsigned conversion error that causes a buffer overflow:
This final screenshot shows a buffer overflow in the CANbus subsystem, this time caused by an ineffective size check due to relying on assertions that are compiled-out in production releases:

Read, scan, review, confirm, rinse, repeat… That’s pretty much the gist of it. Have fun auditing large codebases with the help of Semgrep!
Shoutz
raptor@blumenkraft ~ % host -t txt shoutz.phrack.org
shoutz.phrack.org descriptive text "To the old farts in #!oscar"